Water Activity (aw): The "Availability" of Water
"In food chemistry, knowing the amount of water isn't enough. You need to know the energy status of that water."
Related Concepts
1. What is Water Activity?
Knowing the moisture content tells you how much water is in the food, but Water Activity (aw) tells you what that water is doing.
The Definition
Water activity is the ratio of the vapor pressure of water in a food ($P$) to the vapor pressure of pure water ($P_0$) at the same temperature.
The Scale: Ranges from 0.0 (Bone Dry) to 1.0 (Pure Water).
- Bound Water: Chemically attached to salt, sugar, or proteins. It is "unavailable" for bacteria.
- Free Water: Roaming freely. Bacteria can drink it, and chemical reactions can use it.
Why it matters:
Bacteria generally stop growing below aw 0.91. Molds stop below aw 0.70. This is why honey (high sugar, low aw) lasts forever, while milk (high aw) spoils quickly.
2. Moisture Sorption Isotherm (MSI)
The Moisture Sorption Isotherm is the "map" that shows the relationship between total Water Content and Water Activity at a specific temperature. Most foods follow a Sigmoid (S-shaped) Curve.
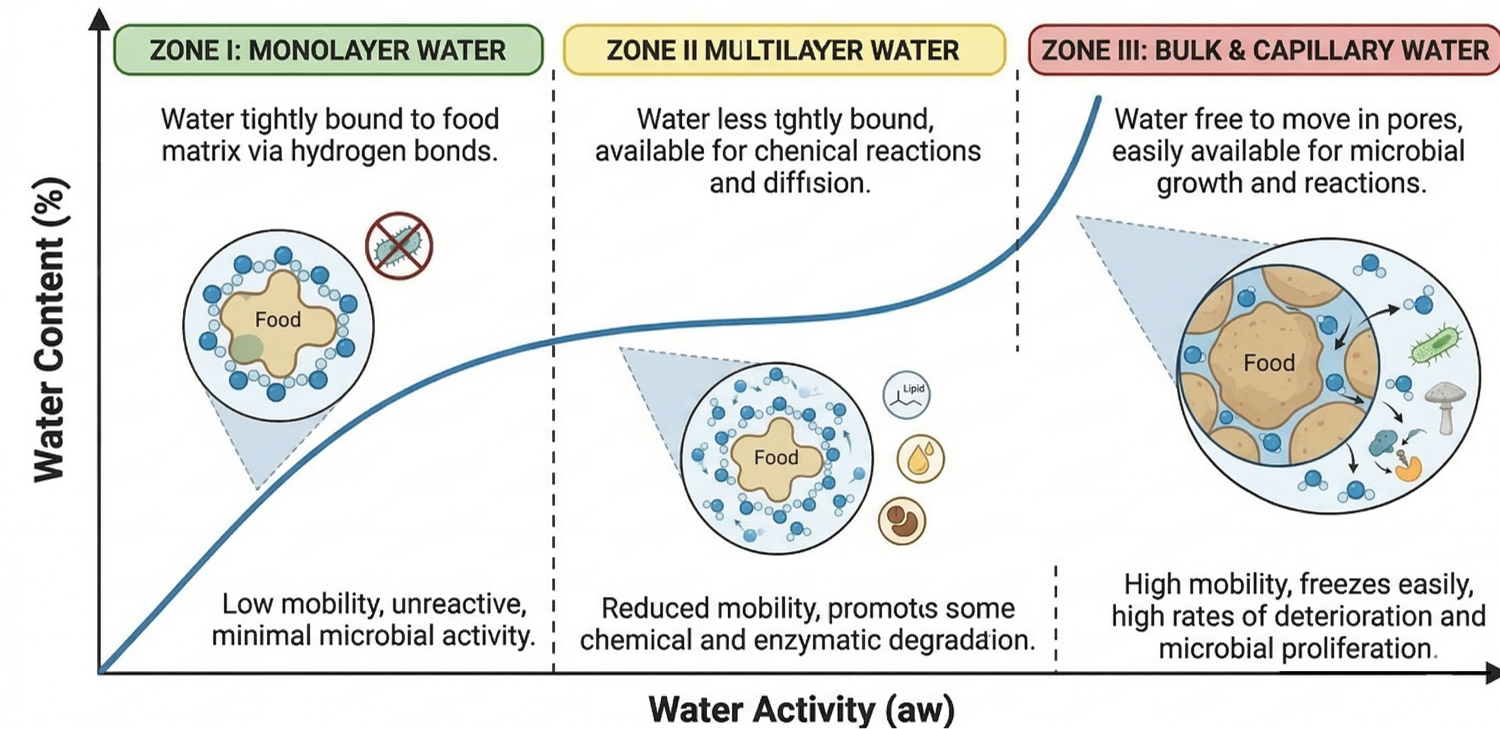
Fig 1. The three zones of water binding in food.
Zone I (The Monolayer - Tightly Bound)
Location: Bottom left ($low a_w$).
Chemistry: Water is stuck directly to food components via strong ionic bonds. It behaves like a solid (unfreezable). Removing this can cause oxidation.
Zone II (The Multilayer - Loosely Bound)
Location: Middle linear region.
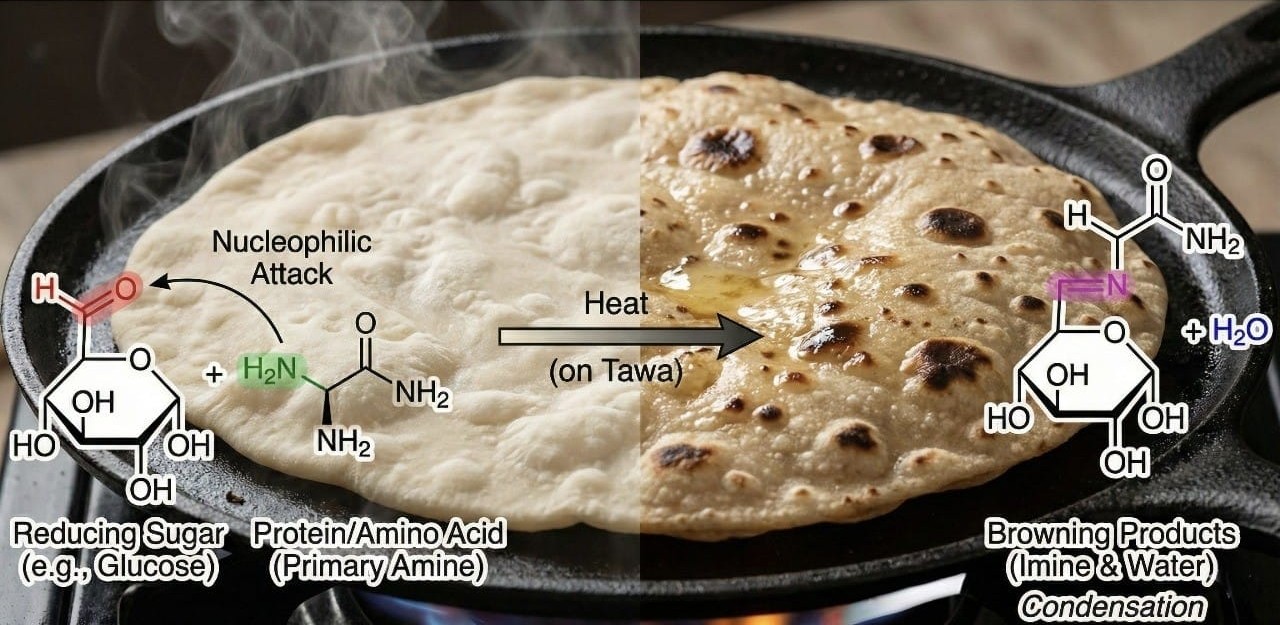
Chemistry: Water forms layers on the monolayer. The food becomes pliable. Danger Zone: Maillard reaction peaks here.
Zone III (The Bulk Water - Free)
Location: Top right ($high a_w$).
Chemistry: Trapped in capillaries or free liquid. Acts as a solvent. Playground for bacteria and mold.
3. Hysteresis: The Loop
You will often see two lines on the graph instead of one. The path of drying (desorption) does not overlap with the path of re-wetting (adsorption).
The "Ink-Bottle" Effect
At the same water activity, a food being dried will usually hold more water than a food being re-wetted. This is due to the physical shape of pores in the food structure trapping water differently.
Summary: aw vs. Moisture Content
| Feature | Water Activity (aw) | Moisture Content |
|---|---|---|
| What it measures | Energy/Availability (Quality) | Total Mass (Quantity) |
| Predicts | Spoilage, Safety, Microbes | Yield, Cost, Texture |
| Range | 0.0 - 1.0 | 0% - 100% |
| Relationship | Mapped by the Sorption Isotherm Graph | |
Interesting Applications
🥩
Beef Jerky & Dried Mango
Removing water to aw below 0.85 stops bacterial growth — the principle behind all dried snacks.
🍯
Honey Never Spoils
Honey's aw ~0.6 is far too low for any microorganism — shelf-stable for thousands of years.
🍪
Crispy Crackers Go Limp
Texture is driven by aw — crackers soften when they absorb moisture and water activity rises.
🍞
Mould in Bakery
Bread above aw 0.90 grows mould within days; humectants lower aw while preserving texture.